Description
This is a small package meant to analyze pressure clamp data generated in HEKA patchmaster software using python. Currently, the package includes p50 and single- channel analysis.
Installation
This package can be installed by running the following command in your terminal:
pip install pressureclamp
Examples
Plot raw or preprocessed pressure clamp data. Then fit and analyze the corresponding pressure-response curves.
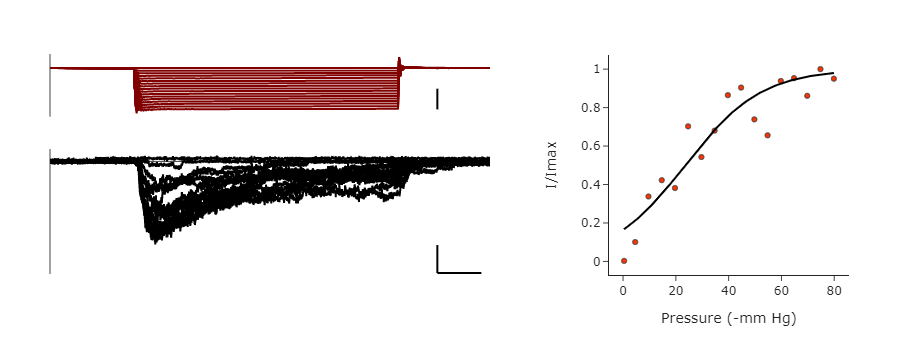
Fig 1. Left. Baseline subtracted current traces from mouse Piezo1. Right. Corresponding pressure-response relationship fitted with a Boltzmann sigmoid.
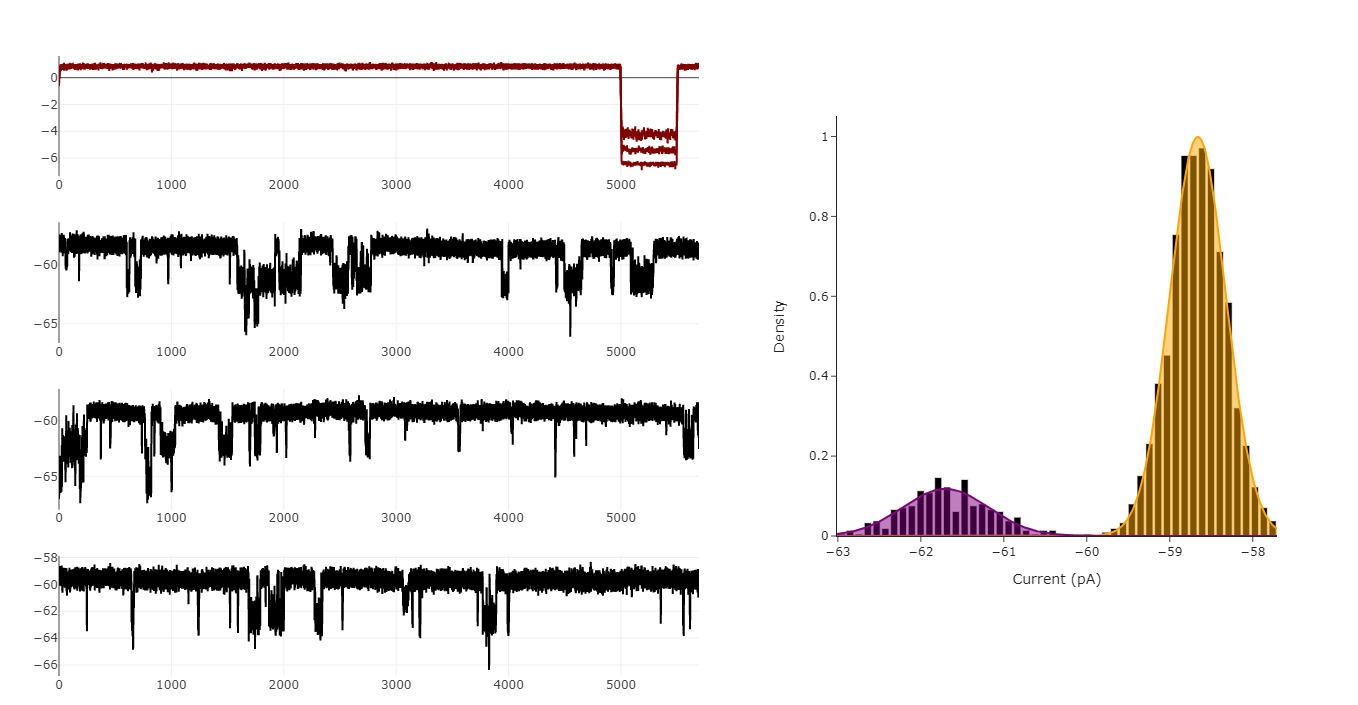
Fig 2. Left. Single-channel current traces of mouse Piezo1. Right. Double gaussian fit of an isolated single channel trace.
Note
To see an example analysis pipeline see the Jupyter Notebook in the examples folder. You can view the notebook online with interactive plots by going to https://nbviewer.org/ and pasting the following url:
Roadmap
This package was made for training purposes but if you would like to request specific features please email me at neuromyoung@gmail.com.